Wild Bee Diversity Prediction Tool
About the Maps
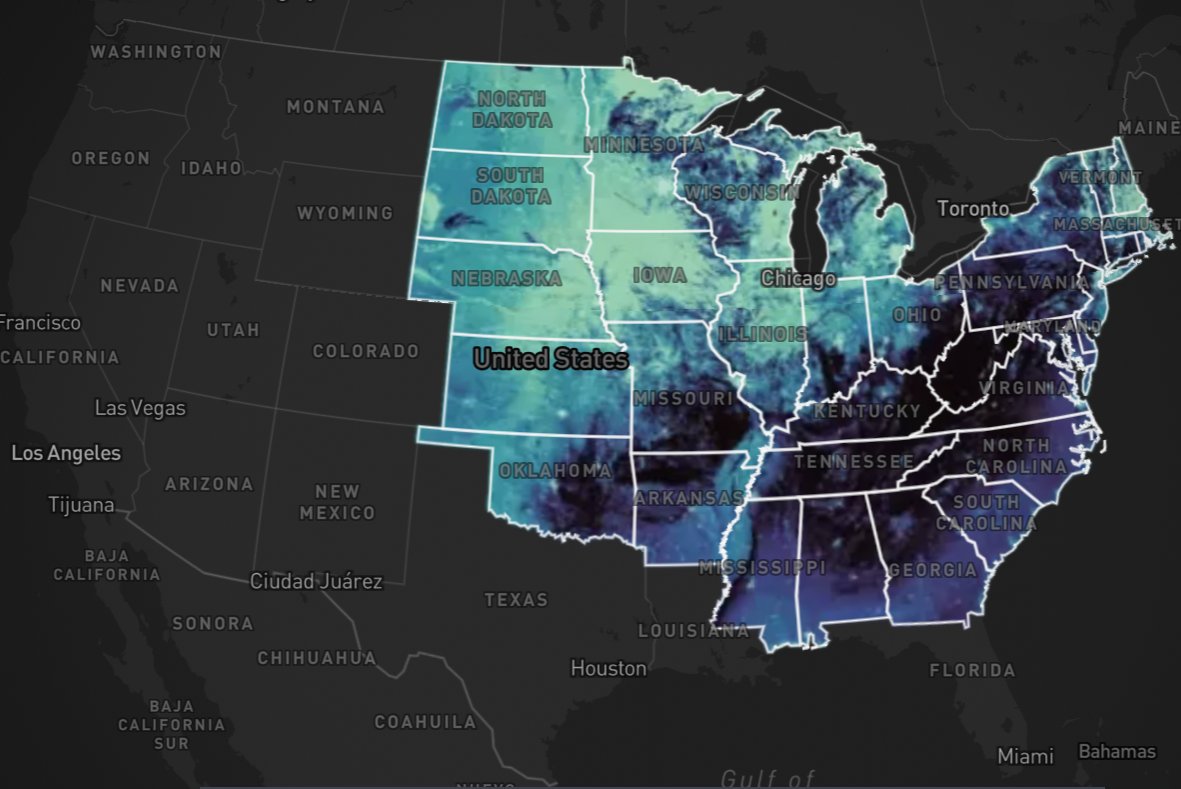
The maps above display predictions of: (1) Richness: the number of wild bee species, (2) Conditions: trends in landscape conditions for bees, and (3) Combined: this map integrates both the richness and landscape conditions, and you can click a location for recommended actions. These predictions are based on ecological indicators that use birds and land cover data from 33 states in the central and eastern U.S.
These maps depict predictions, not actual measurements nor estimates based on field surveys of bees or habitats. You can think of these predictions as providing evidence-based “best guesses” that can help to guide conservation in the absence of bee data. Please consult with regional or local experts and/or use local data sources whenever possible. We encourage you to support bee monitoring programs and the important work of experts who study and conserve bees.
In addition, species richness (the number of wild bee species) does not necessarily reflect the conservation value of a location for wild bees. An area with low richness, for example, may be essential for a specialized, threatened, or endemic bee species, whereas an area with high richness may contain common or abundant species of lower conservation concern.
Contact wildbeemaps@cornell.edu if you wish access to the map data.